1 Comment
 *Taken from Mark Skousen's "Forecasts and Strategies" paper (January 19, 2018)* Gross Output, the top line of national accounting that measures spending at all stages of production, gained momentum in the 3rd quarter of 2017. The latest GO data indicates that the economy is poised for strong expansion in 2018 even before the tax reduction bill that was passed in December 2017. By focusing solely on final spending and the end of the economic chain, GDP can sometimes be a misleading indicator of economic performance. GO is a much better, more comprehensive view of total economic activity along the entire supply chain. GO anticipates changes in GDP by as much as 12 weeks in advance and thus serves as a reliable leading indicator. The spending increase in the early stages of production, such as manufacturing, is usually a reliable leading economic indicator that overall economic growth should continue to expand. It is important to monitor the growth rate in the mining sector as an early indicator of economic expansion, but the manufacturing sector accounts for 18% of total GO and 18% of GO is also finance, insurance, real estate, rental and leasing sectors. The largest drop of 10.6% was in the Utilities sector. Gross Output and GDP are complementary statistics in national income accounting. GO is an attempt to measure the "make" economy (total economic activity at all stages of production). GDP is an attempt to measure the "use" economy (the value of finished goods and services ready to be used by consumers, business, and government. GDP is similar to the "bottom line" or "value added". GO tends to be more sensitive to the business cycle, and more volatile, than GDP. Business-to-business spending is in fact a pretty good indicator of where the economy is headed, since it measures spending in the entire supply chain. GO is a more comprehensive measure of economic activity. GDP leaves out the supply chain and business to business transactions in the production of intermediate inputs. GO and GDP are complementary aspects of the economy, but GO does a better job of measuring total economic activity and the business cycle and demonstrates that business spending is more significant than consumer spending. By using GO data, we see that consumer spending is actually only about a third of economic activity, not two-thirds that is often reported by the media. Business spending is almost twice the size of consumer spending in the US economy.  The Federal Reserve was created to help reduce the injuries inflicted during economic downturns by changing the supply of money.
The Fed primarily manages the growth of bank reserves and money supply to allow a stable expansion of the economy. Their tools include: changing reserve requirements, changing the discount rate, and by open market operations. Changing the reserve ratio is the percent change of reserves a bank is required to hold against deposits. A decrease will allow the bank to lend more and thereby increasing money supply. An increase will have the opposite effect. Discount rate is the interest rate the central bank charges commercial banks that need to borrow additional reserves. If the rate is low, it encourages spending and if it is high, it encourages saving. Open market operations consist of buying and selling of government securities by the Fed. If the Fed buys, it increases the money supply. If the Fed sells, the money supply decreases.

A recession is a period of economic decline that can hurt the livelihood of millions and by having many recessions throughout history, indicators were found to predict when recessions would occur. The most significant indicators of a recession are:
I will only discuss the first one. 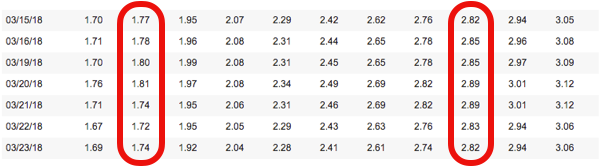 https://www.treasury.gov/resource-center/data-chart-center/interest-rates/Pages/TextView.aspx?data=yield This is a daily chart of the treasury yield curve rates. The first highlighted box going from left to right are the 3 month interest rates and the second highlighted box are the 10 year interest rates. A negative spread between 10 year T-bonds and 3 month T-bonds means that if the 3 month rates are greater than the 10 year rates, it creates a negative spread and could trigger an economic downturn.
The Federal Reserve was created to help reduce the velocity and magnitude of an economic downturn. In 1913, the Federal Reserve was originally formed to prevent the money supply and credit from drying up during recessions. One of the biggest tools the Feds have is the ability to loan millions or billions or even trillions of dollars to banks that would then be induced to lend more money. The Federal Reserve's top duties today are to manage the bank reserves and money supply to allow the economy to expand securely. They fulfill these duties by changing reserve requirements (when needed), change the discount rate (when needed), and perform open market operations like buying and selling government securities. The Federal Reserve has a vital role in the US economy. When the economy is in a downturn, the Feds increase the supply of money to spur growth. When inflation is threatening, the Feds reduce the threat by shrinking the supply. By the Feds managing money supply, they are able to control the economy and help the U.S. go through the business cycle successful.  The selling stage is when profits or losses are determined. Buying sets the purchase price of how much you will gain or lose, but selling guarantees the gain or loss. Example: Say you buy 10 shares of XYZ at a price of $10. XYZ goes up 20% to $12 and your equity increases by $20 (# of shares x change in price), but you do not realize (profit) the $20 until you sell. The biggest reason people have trouble selling is because of greed; they want more and more and more gains. Greed and emotion turns profits into losses. Learning how to properly sell helps ensure the preservations of gains and reduces the likelihood of incurring huge losses. Limit and Stop Orders reduce your loss exposure. A Limit Order is an order that sets the maximum and minimum at which you are willing to buy or sell. A Stop Order is an order to buy or sell once the price reaches a specified price. 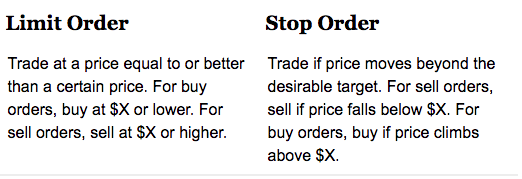 https://www.diffen.com/difference/Limit_Order_vs_Stop_Order Never attempt to time the market. Your goal is to buy at one price, and sell at a higher price.
Budgeting is a great financial skill that will allow you to avoid debt, will keep you organized and up-tp-date with your expenses and income, and will help you build strong spending habits. A budget will help you plan for short-term expenses such as your monthly bills; mid-term expenses such as vacations; and long-term expenses such as buying a house, paying for a child’s college education or putting away money for retirement. A good budget can help keep your spending on track and even uncover some hidden cash flow problems that might free up even more money to put toward your other financial goals. You need to know where your money is going if you want to have a handle on your finances. The first step in planning a budget is to map out the sources of your income and where that money is going. Begin by listing your income, and list your expenses starting with the most important to the least important. The goal is to have your expenses be less than or equal to your income. If you have additional money after you plan your budget, you can add it to the categories for your financial goals like getting out of debt or building an emergency fund. If you have more expenses than income, you will need to find ways to cut back on your expenses. There are two ways to initiate a budget: you can either be more hands-on with your money or you can inactively track and manage your money. The actively tracking method consists of using an Excel budgeting template. You track every expense and income in monthly intervals. 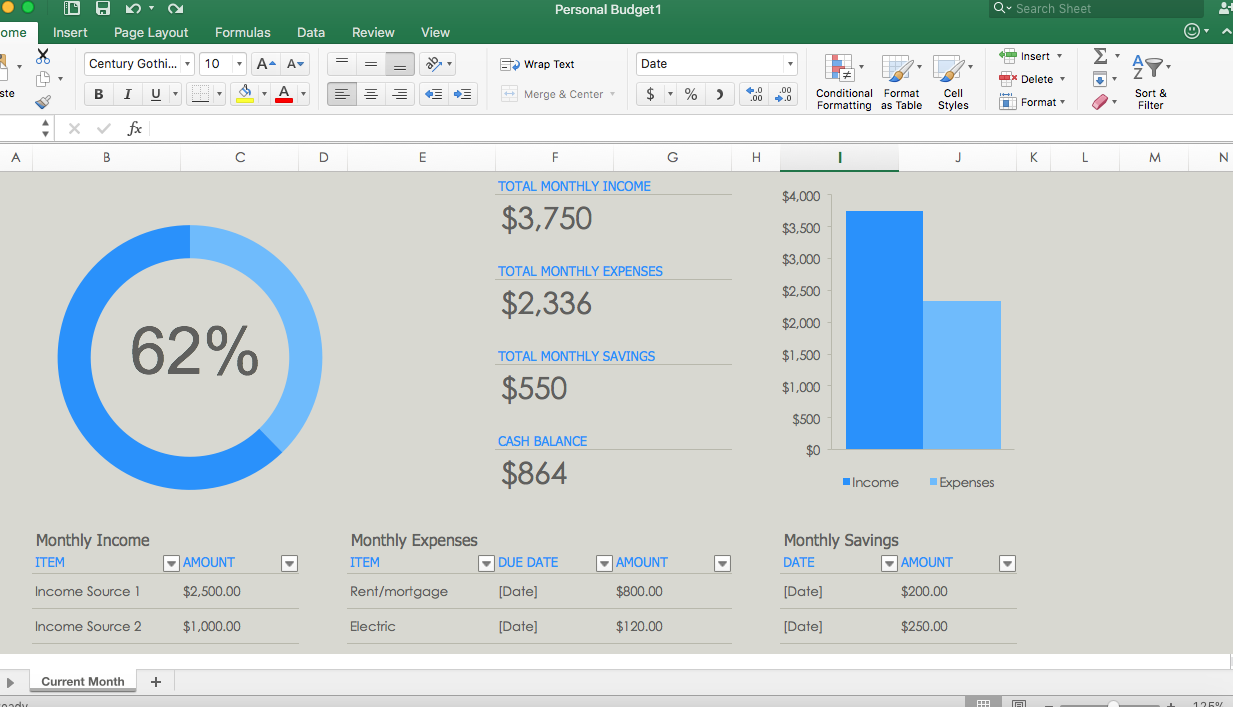 For every dollar you spend or make, you will use the Excel sheet to write it out. Focus on the “Income” and “Expenses” columns. Remembering and having the will to fill out the Excel sheet will take hard work and dedication, but with time, it will become natural. A tip is to collect your receipts. For every transaction you make, get the receipt and put them in a folder. Then instead of tracking your expenses per transaction, at the end of the month you can file through your receipts and list them once. Once you have mastered the art of budgeting, then you can start focusing on the “Savings” column. When your income is more than your expenses, you can start allocating that money into savings. It is important to save money for future expenses and worst scenario, if you lose your income source, you will have funds to support you until you find a new source of income. The second method is an inactive way of managing and tracking your money, and this involves using apps. These apps help keep track of your expenses and income for you and give you tips when they see irregular spending or when your expenses outweigh your income. A tip is to download all of them and test which ones work best for you. Some cost money, but some are also free. The hardest part of a budget is when your expenses are more than your income. Some ways to control this are: become more frugal with your spending, use coupons and look for price differences, cap your money at a certain amount each month, and use only cash. A budget is a powerful tool because it allows you to determine how and where you want to spend your money; every dollar is being used how you want it. Start budgeting today and you will see a huge difference in your finances.
Besides these rules, the experience of making mistakes and the practice of failing will teach you the true lessons of investing. I got introduced into stocks from my grandmother. I was always interested in finances and making money and with her, I was able to ask questions, receive real-world answers, and I was able to learn from her wisdom. Then, I received a book called "Stock Market Logic" by Norman G. Fosback from my grandfather. When reading it at a young age, it was very difficult to comprehend, and I only understood the basics of how nobody can consistently outperform the market and how everyone is the market. At the age of thirteen, I started trading stock. I remember begging my father to allow me to start trading. I showed him my research and I told him what stocks I wanted to invest in, and finally he gave in. A week later, I went with him to see our family stockbroker at Charles Schwab with a check written out for $2,000. Before we went into Nicollo's office, my father told me to sit there quietly and let him handle the business. My father handed Niccollo the check and told him that I wanted to add to my portfolio; the portfolio my parents and grandmother started for me when I was born. Then, Niccollo went on with advising us on stable, low-risk stocks that I should be investing in; turning his screen around to show us all of these graphs with an assortment of pretty colors and lines. (Back then, I did not know anything about trends and patterns so I was in a state of cluelessness). I pulled out my numbered list of stocks that I had created and handed it to him. Long story short, I invested in three companies that day with one of the investments being a recommendation by him: Amazon, Netflix, and Ford. As of February 15, 2018, Amazon has had a 327% unrealized gain, Netflix a 439% unrealized gain, and for Ford, besides their $.60 yearly dividend, I am currently at a loss. (Ford was the recommendation.) In high school, I gained access to my portfolio and I started to trade with permission from my parents. I was exposed to risk, gain, and loss and I was loving it. I had my apps where I was able to track stocks, make predictions, and view data, and I bought stocks from that research. When I turned eighteen, I opened up my own individual portfolio and I learned the hard lessons of day-trading. I used to wake up every weekday at 6am right before the market opened to submit my orders. I was so active in trading that once I placed multiple trades using the slow, limited-access WIFI in a bus station in Bratislava, Slovakia. I could not get enough and I was hypnotized on the idea of getting rich quick. Having this mindset caused me to make many mistakes which include:
The lessons to be learned are:
 Inflation is the general increase in prices of goods and services.
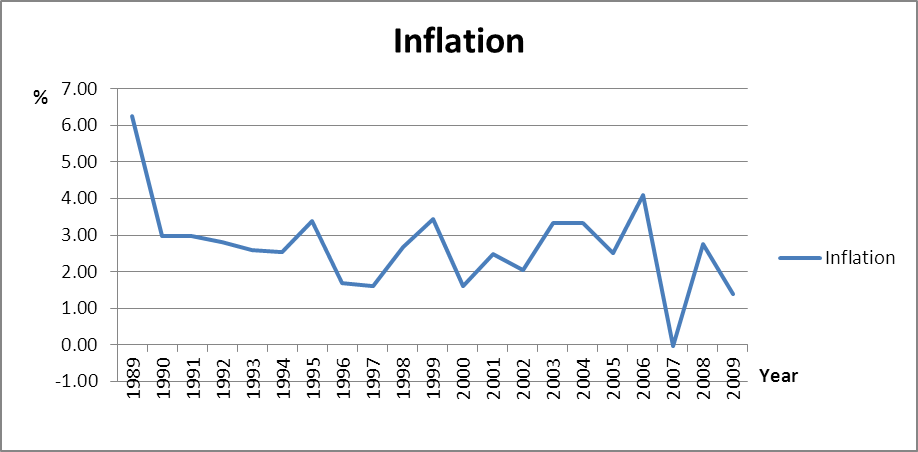 https://commons.wikimedia.org/wiki/File:US_Inflation_rate.png
USD v GoldInverse relationship. A falling dollar increases the value of other countries’ currencies. This increases the demand for commodities including gold and it increases the price of gold. When the U.S. dollar starts to lose its value, investors look for alternative investment sources to store value. Gold is an alternative. Inflation v InterestInverse relationship. As interest rates are lowered, more people are able to borrow more money. The result is consumers have more money to spend, causing the economy to grow and inflation to increase. As interest rates are increased, consumers tend to save as returns from savings are higher. With less disposable income being spent as a result of the increase in the interest rate, the economy slows and inflation decreases. Stocks v Bonds Inverse relationship and correlated for special occasions. Stocks do well when the economy is booming; consumers are buying and companies have better earnings. Bonds do well when the economy is in decline, and investors prefer the guaranteed interest payments from bonds. At the top of the market when there is too much liquidity, investors are buying both bonds and stock and both rise. When investors have fear, they panic sell and bonds and stock both go down. Earnings drive stock prices and interest rates drive bond prices. 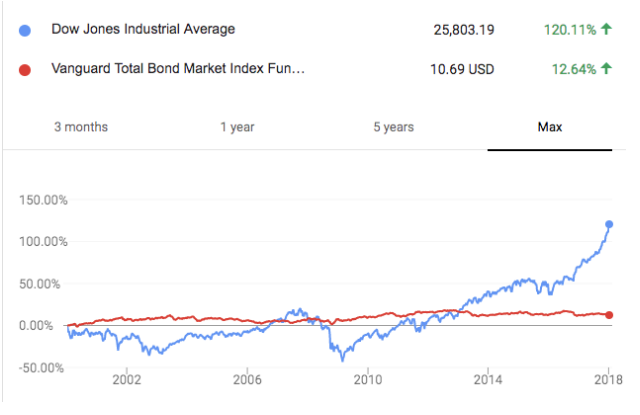 DOW Jones vs Bonds: The bond market showed steady growth while the DOW suffered a significant loss. This lasted until the end of the recession. Bonds v GoldGold is generally viewed as an inflation hedge while bonds are viewed as a deflation hedge. Gold and bonds are both used by traders as a common safe-haven hedge. When volatility is high and stocks are behaving erratically, investors tend to flock to assets that hold their value better. A vote of no-confidence in the stock market can translate into a bullish rise for both Treasuries and gold prices. If the Federal Reserve takes action such as increasing the money supply through bond purchases, this will lift bond values as well, while sending investors a message that the economy may be weak – something that helps gold prices go higher. But interest rates are the real underlying fundamental force between gold prices and Treasuries. If inflation rises faster than the yield of the 10-year Treasury making real rates negative, then gold becomes a wealth preservation trade. It might not offer investors a yield, but it does protect against the devaluation of their money. In this kind of scenario, interest rates may rise along with inflation, but if real rates are still negative, then gold prices should rise along with them – while the price of bonds falls. Stocks v GoldCompletely inverse. 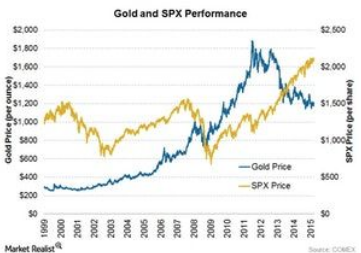 Bonds v InterestInverse relationship. Bond prices fall as interest rates rise. As interest rates move up, the cost of borrowing becomes more expensive. This means that demand for lower-yield bonds will drop, causing their price to drop. As interest rates fall, it becomes easier to borrow money, and many companies will issue new bonds to finance expansion. This will cause the demand for higher-yielding bonds to increase, forcing bond prices higher. When the US economy is acting poorly, central bankers tend to lower interest rates to help stimulate growth. As interest rates go down, bond prices go up. Stocks v Interest Inverse relationship. When interest rates are rising, both businesses and consumers will cut back on spending. This will cause earnings to fall and stock prices to drop. On the other hand, when interest rates have fallen significantly, consumers and businesses will increase spending, causing stock prices to rise. Stocks v InflationStudies have produced conflicting results when several factors are taken into account, namely geography and time period. If all commodities are going up stocks would probably go up as well, since companies produce commodities. But that isn’t always the case. Often high inflation can actually squeeze profit margins and cause companies to lose money or barely break even. 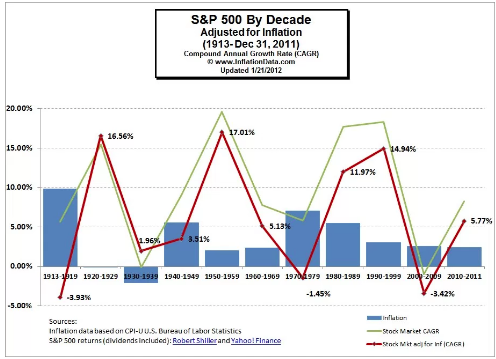 Bonds v Inflation The first effect is that rising inflation can cause the U.S. Federal Reserve to raise short-term interest rates in order to reduce the demand for credit and help prevent the economy from overheating.When the Fed raises short-term rates, longer-term rates also tend to go up. Since bond prices and yields move in opposite directions, rising yields mean falling prices—and a lower principal value for your fixed-income investment. Raising inflation rates also take a huge chunk out of the value since the inflation is likely to overshadow the growth of the bond.
|
AuthorMy name is Camden Alchanati and my goal is to teach you how to create a future of financial stability and growth! 
Archives
June 2020
|
 RSS Feed

Phone: (323)-553-2411
alchanatiandassociates@gmail.com
|
|

All information stated does not represent The ACA Foundation's opinions and we do not claim responsibility for most of the content. This website does not provide individual or customized legal, tax, accounting, or investment advise.
All Rights Reserved
All Rights Reserved